Patent applications from academia: International ranking by country and individual university
Maike Haag / Enno Kohlisch / Oliver Koppel IW-Kurzbericht No. 79 15. October 2024 Patent applications from academia: International ranking by country and individual university
In a country comparison of international patent applications from the higher education sector, Switzerland excels in efficiency. The USA dominate in terms of the number of patent applications and in the ranking of the 1,767 patent-active universities across the globe. Germany performs well across all categories, placing just behind the USA in efficiency.
Maike Haag / Enno Kohlisch / Oliver Koppel German Economic Institute (IW)
In a country comparison of international patent applications from the higher education sector, Switzerland excels in efficiency. The USA dominate in terms of the number of patent applications and in the ranking of the 1,767 patent-active universities across the globe. Germany performs well across all categories, placing just behind the USA in efficiency.
Our IW patent database includes universities as well as their affiliated institutions that applied at least once for a patent since 1994. To ensure a fair and meaningful comparison of patent performance across countries, we analyze international patent applications seeking protection in multiple countries including Germany to ensure a consistent quality standard. This requirement minimizes the risk of a home bias. For example, US universities benefit heavily when counting US-only patent applications (NAI, 2024).
In addition to the patent performance of the universities themselves, this analysis also includes their affiliated institutions (academic teaching hospitals, affiliated research institutes, etc.). Patents from institutions with a single affiliation are assigned to the corresponding university. However, patents from institutions with multiple affiliations cannot be attributed to a specific university. Examples are the Scripps Research Institute, the Charité Berlin or the Flemish Institute for Biotechnology. Therefore, the performance of these institutions is included in the aggregated analysis of the higher education sector by country, but not in the ranking by individual institution. Patents filed by technology transfer centers are attributed to the universities themselves. The patent applications of universities that are organized in a network are aggregated at the network level. Additionally, non-university research institutions and associations (Helmholtz Association, Chinese Academy of Sciences, etc.) are only included when a specific institute is explicitly affiliated with a university. Traditional companies owned by universities are excluded. This applies, for example, to the Bose Corporation, which is owned by the Massachusetts Institute of Technology through a donation, and to subsidiaries of Tsinghua University.
To assess the innovative strength in academia, patents filed by a university as the initial applicant are considered and measured fractionally. If a university jointly applies for a patent with a company, half is attributed to the university; if it is the sole applicant, it is attributed in full. Patents are allocated to countries by the residence of the applicant. Due to the disclosure period, 2021 is the most recent year available.
Content element with id 13933
Content element with id 13937
University patent performance by country
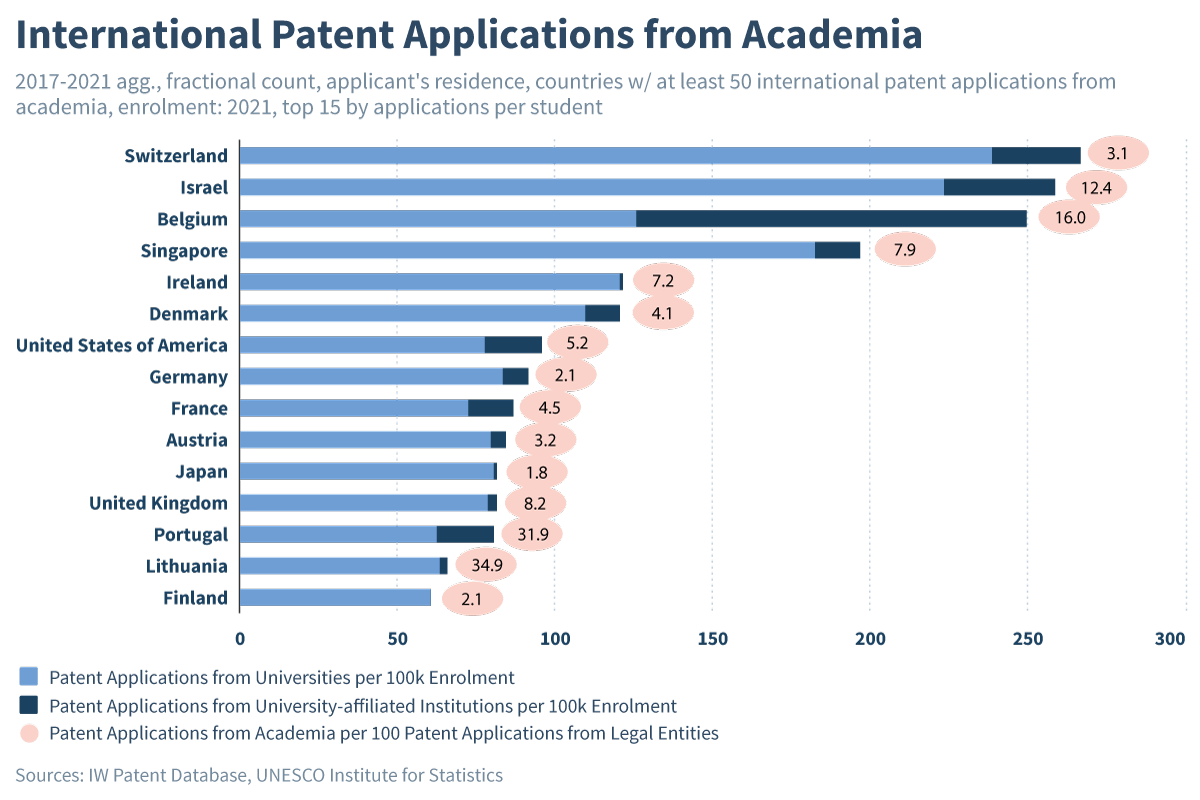
The figure shows the top 15 countries measured by the cumulative patent performance of their higher education sector from 2017 to 2021 per 100,000 students (ISCED levels 6-8), with the segments “Universities” and “Affiliated institutions” shown separately. Therefore, the number of international patents relative to the size of the higher education sector measures the patent efficiency.
Front-runner Switzerland achieves an impressive 267 patents per 100,000 students. This result is due to a university landscape with a strong focus on technology and natural sciences and therefore a strong patent affinity. The research-strong universities in Lausanne and Zurich are at the forefront. Israel follows closely with 259, also driven by universities with a focus on science and technology, such as Tel Aviv University and the Weizmann Institute of Science. The latter also sets itself apart with a unique technology transfer strategy. It initially grants licenses for its patents free of charge and only receives a share of the potential profits. Belgium secures third place with 250 patents per 100,000 students. Half of this performance comes from affiliated institutions, the highest among all analyzed countries. The Belgian facility of the Interuniversity Micro-electronics Center, a leading research institute in nano- and microelectronics closely linked to the Flemish universities in Leuven and Hasselt, is primarily responsible for this achievement.
With 92 patent applications per 100,000 students, Germany stands at a respectable eighth place, just behind the USA. Despite a steadily increasing number of university patents, China does not qualify for the top 15 of the efficiency ranking, producing only 5 patents per 100,000 students due to its high student population.
The figure also shows the percentage share of the higher education sector in relation to all international filings by legal entities from the country. This indicator particularly highlights the importance of the higher education sector compared to the corporate sector, which generates the majority share of all patents. In Germany, this value is 2.1 percent. Switzerland’s reference value is a whole percentage point higher, and the USA’s even 3 percentage points. The fact that around one in three patent applications in Lithuania and Portugal stems from academia may, however, rather indicate a certain patent weakness in their corporate sector.
In absolute terms, the USA account for 34.5 percent of all international patent applications from the higher education sector, declaring it the leading country in the ranking. It is followed by Germany (8.9 pct.), Japan (7.3 pct.), the United Kingdom (6.0 pct.), and France (5.6 pct.). However, in the efficiency ranking, the USA are only in 7th place, as it has 14 times as many patents but 38 times as many students as Switzerland.
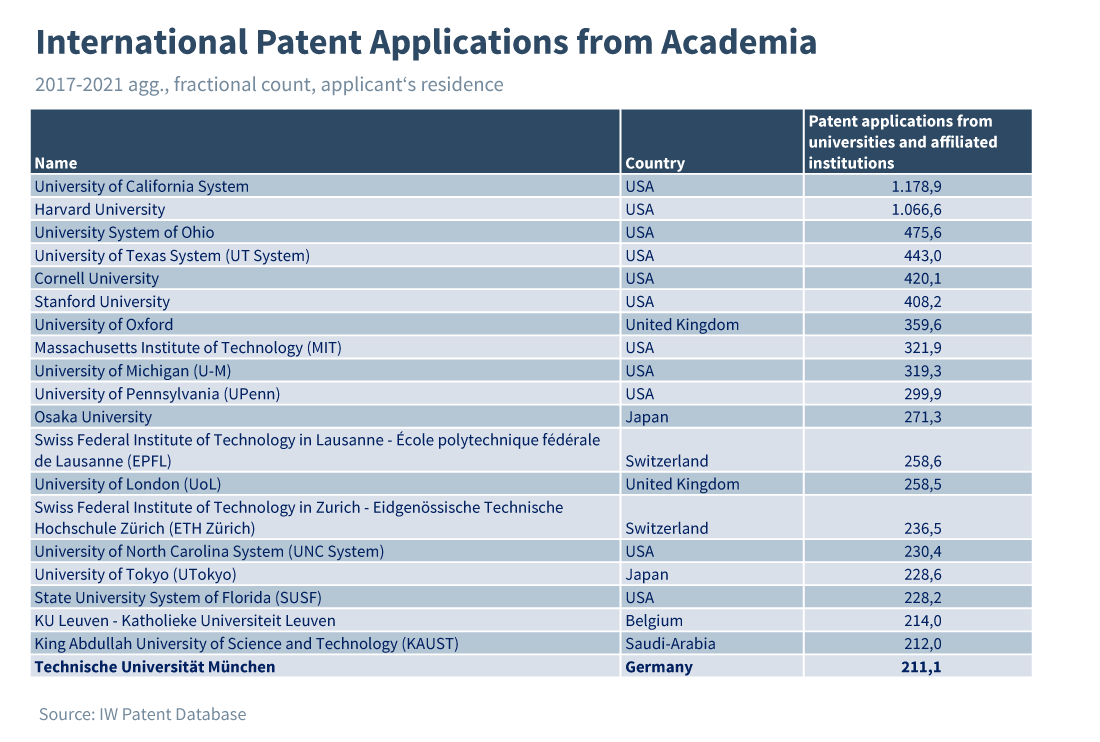
Patent performance by university
Based on the number of international patents, the ranking of the 1,767 patent-active universities is dominated by the USA. The University of California with its flagship campus in Los Angeles tops the list. While Harvard University's academic department shows significantly lower patent activity, the privately funded university benefits from its affiliated institutions such as the Dana-Faber Cancer Institute or the Massachusetts General Hospital and ranks second place. The University of Oxford is the highest-ranking non-US and European university, placing 7th, while Osaka University is the top Asian university, just missing the top 10. In Germany, the Technical University of Munich (TUM) achieved 20th place and thus the country’s top position, ahead of the Technical University of Dresden (34th place) and the Karlsruhe Institute of Technology (39th place). Compared to the domestic German ranking (Haag et al., 2024), which also includes patent applications seeking protection only in Germany, the particularly high proportion of international patent applications proves to be an advantage for the TUM.
Last but not least: Around 21 percent of all patent applications from the global higher education sector are generated by privately funded universities. This figure peaks at 44 percent in the USA but is just 0.2 percent in Germany.
Enno Kohlisch / Oliver Koppel / Thomas Puls IW-Trends No. 4 13. November 2023
The Transformation of the Automotive Industry: An International Comparison of Germany's Innovation Performance
The automotive industry is undergoing a comprehensive technological transformation that is challenging established value chains. Making sure that domestic research helps to shape this ongoing transformation is therefore an important task for countries with a ...
Maike Haag / Hanno Kempermann / Enno Kohlisch / Oliver Koppel IW-Analyse No. 153 2. June 2023
Innovation Atlas 2023: The innovative strength of the German regions
All indicators of innovative strength in Germany – from research intensity and scientific and technical employment structures to patent successes – point to a strong south-north, west-east and urban-rural divide.
Maike Haag / Hanno Kempermann / Enno Kohlisch / Oliver Koppel IW
This website uses necessary cookies to ensure the operation of the website. An analysis of user behavior by third parties does not take place. You can find detailed information about the use of cookies in our privacy policy.
Warning: You are using an outdated browser!
Please switch to a modern browser (e.g. Google Chrome, Firefox or Microsoft Edge) in order to enjoy the best user experience.